15. Explore Color Spaces
Explore Color Spaces
You can study the distribution of color values in an image by plotting each pixel in some color space. Here's a code snippet that you can use to generate 3D plots:
import cv2
import numpy as np
import matplotlib.pyplot as plt
from mpl_toolkits.mplot3d import Axes3D

def plot3d(pixels, colors_rgb,
        axis_labels=list("RGB"), axis_limits=((0, 255), (0, 255), (0, 255))):
    """Plot pixels in 3D."""

    # Create figure and 3D axes
    fig = plt.figure(figsize=(8, 8))
    ax = Axes3D(fig)

    # Set axis limits
    ax.set_xlim(*axis_limits[0])
    ax.set_ylim(*axis_limits[1])
    ax.set_zlim(*axis_limits[2])

    # Set axis labels and sizes
    ax.tick_params(axis='both', which='major', labelsize=14, pad=8)
    ax.set_xlabel(axis_labels[0], fontsize=16, labelpad=16)
    ax.set_ylabel(axis_labels[1], fontsize=16, labelpad=16)
    ax.set_zlabel(axis_labels[2], fontsize=16, labelpad=16)

    # Plot pixel values with colors given in colors_rgb
    ax.scatter(
        pixels[:, :, 0].ravel(),
        pixels[:, :, 1].ravel(),
        pixels[:, :, 2].ravel(),
        c=colors_rgb.reshape((-1, 3)), edgecolors='none')

    return ax  # return Axes3D object for further manipulation


# Read a color image
img = cv2.imread("000275.png")

# Select a small fraction of pixels to plot by subsampling it
scale = max(img.shape[0], img.shape[1], 64) / 64  # at most 64 rows and columns
img_small = cv2.resize(img, (np.int(img.shape[1] / scale), np.int(img.shape[0] / scale)), interpolation=cv2.INTER_NEAREST)

# Convert subsampled image to desired color space(s)
img_small_RGB = cv2.cvtColor(img_small, cv2.COLOR_BGR2RGB)  # OpenCV uses BGR, matplotlib likes RGB
img_small_HSV = cv2.cvtColor(img_small, cv2.COLOR_BGR2HSV)
img_small_rgb = img_small_RGB / 255.  # scaled to [0, 1], only for plotting

# Plot and show
plot3d(img_small_RGB, img_small_rgb)
plt.show()

plot3d(img_small_HSV, img_small_rgb, axis_labels=list("HSV"))
plt.show()
Analyze video frames
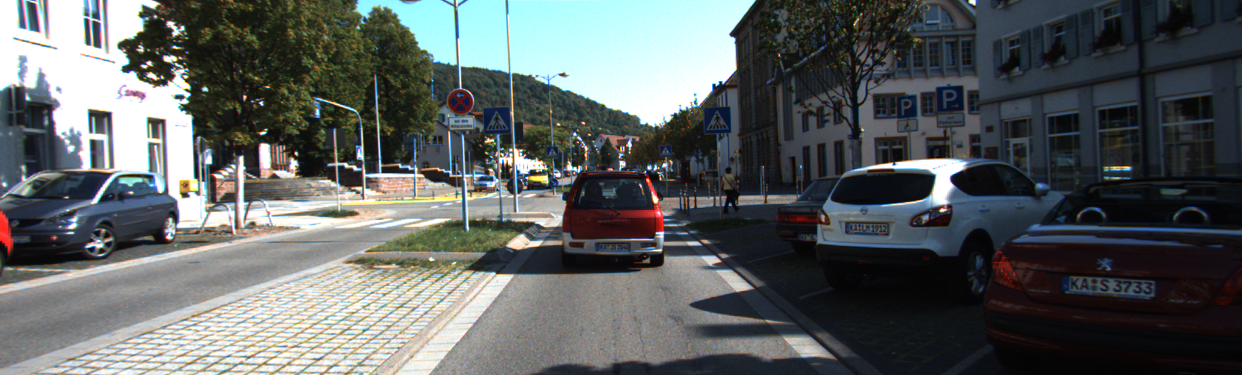
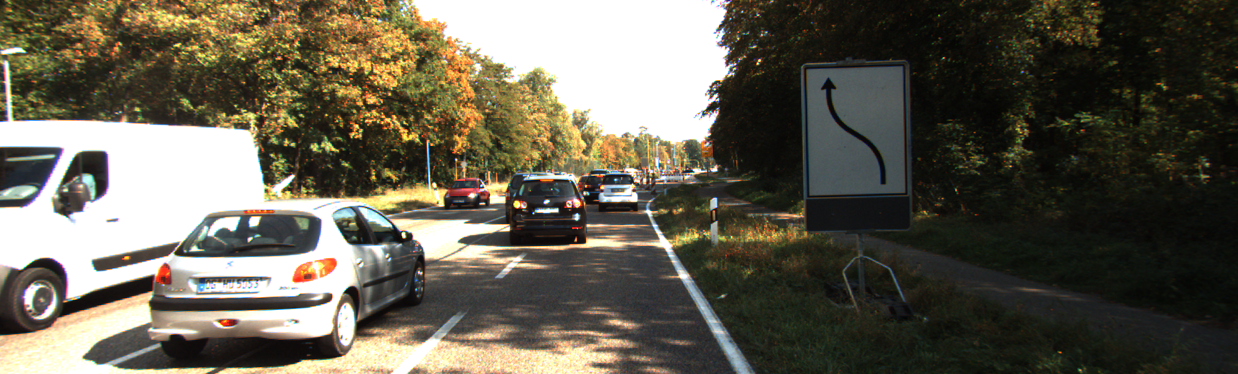
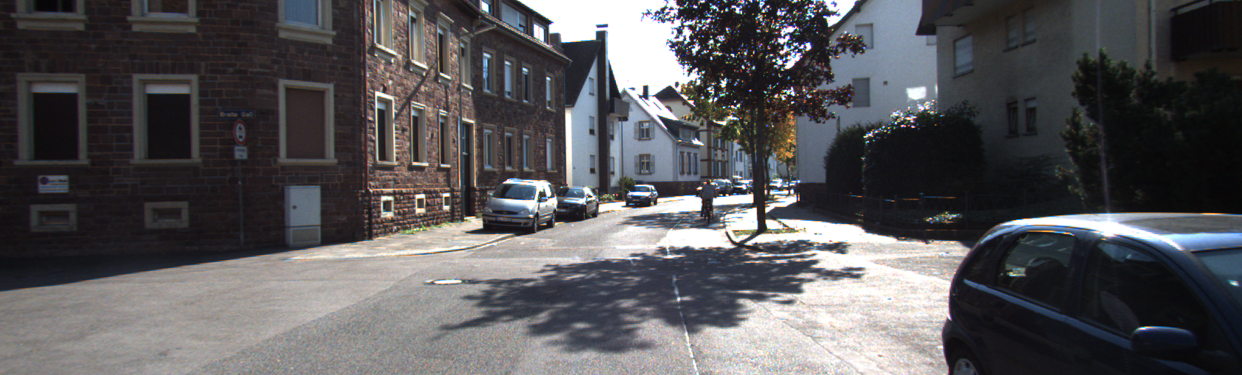
Use this to first explore some video frames, and see if you can locate clusters of colors that correspond to the sky, trees, specific cars, etc. Here are some sample images for you to use (these are taken from the KITTI Vision Benchmark Suite ):
Analyze vehicle and non-vehicle images
You might've noticed that it is hard to distinguish between the class of pixels you are interested in (vehicles, in this case) from the background. So it may be more beneficial to plot pixels from vehicle and non-vehicle images separately. See if you can identify any trends using these samples:


Try experimenting with different color spaces such as LUV or HLS to see if you can find a way to consistently separate vehicle images from non-vehicles. It doesn't have to be perfect, but it will help when combined with other kinds of features fed into a classifier.